Are Overcrowded Shelves Suffocating Travel Retail Sales?
Amidst the allure of novelty and exclusivity, is the relentless flood of new products threatening to overwhelm both retailers and shoppers alike.

In the dynamic world of Travel Retail, where every moment counts and every square inch of shelf space is a battleground, are we losing sight of the bigger picture? Amidst the allure of novelty and exclusivity, is the relentless flood of new products threatening to overwhelm both retailers and shoppers alike.
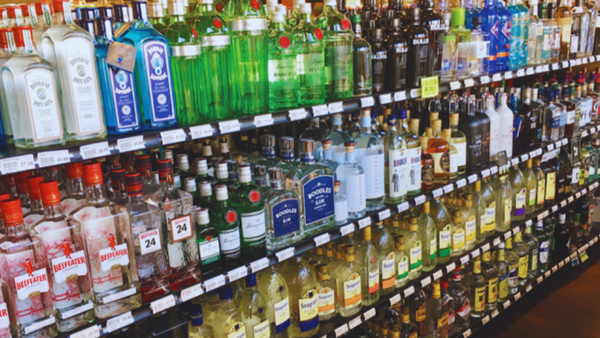
In categories like Alcohol and Confectionery, the pressure to keep pace with the ever-changing market and the ‘need’ to bring newness and exclusivity to Travel Retail is leading to a proliferation of SKUs. During the TFWA even at Cannes 2023, it's not unreasonable to estimate that hundreds of new products were vying for the attention of retail buyers. But with limited space available, this abundance may be stifling rather than invigorating.
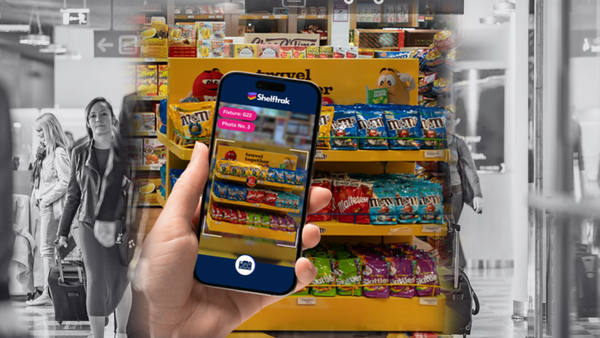
Enter Shelftrak, our tool designed to shed light on the retail environment in airports. One crucial metric we use is the SKU Density Ratio (SDR), a simple yet powerful measure of how efficiently space is being utilised. By dividing the total number of SKUs by the total linear space available in a store, this measure evaluates how densely products are displayed on shelf.

As an example, a store with 500 unique SKUs and a total linear shelf space of 300 metres, the SDR calculation would equate to 1.7 SKU’s being displayed per linear metre.
When we run this calculation at both a total store and sub-category level, we uncover a wealth of insights into shelf density and its impact on visibility and shop-ability.
For example, in the alcohol category across Europe, our data reveals an average SDR of 2.1 (An ave of 2.1 SKU’s per linear metre). At this level, a store that averages around 2 SKU’s per linear metre (Or around 2 SKU’s per shelf) is offering it’s shoppers a reasonably well displayed fixture where each SKU has a decent amount of space to be showcased.
Of course, this does not account for HPPs or gondola ends where that average would soon be reduced. Or conversely, segments such as Premium Wine or Single Malts, where a larger range displayed in a tighter space can be tolerated. These segments have a more discerning customer base and slower purchase cycle. However, even here, an excessively crowded display risks diluting the shopper experience and obscuring premium offerings.
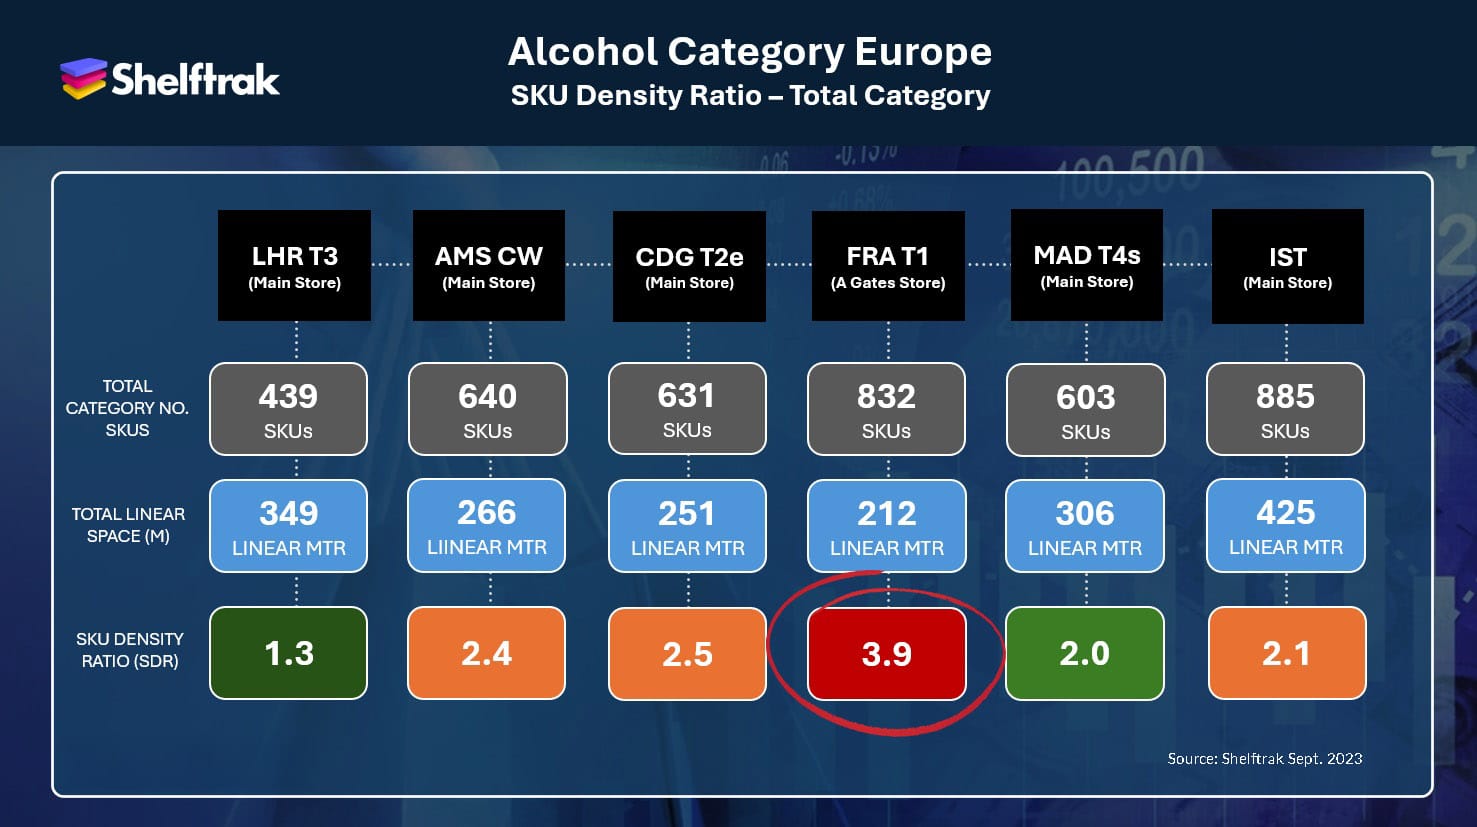
But beneath the surface of these averages, we find some stark discrepancies at both an airport level and at a sub-categories level as the chart below demonstrates. Here we see a high score of 3.9 SDR in Frankfurt T1 and a low score of 1.0 SDR for LHR T3.
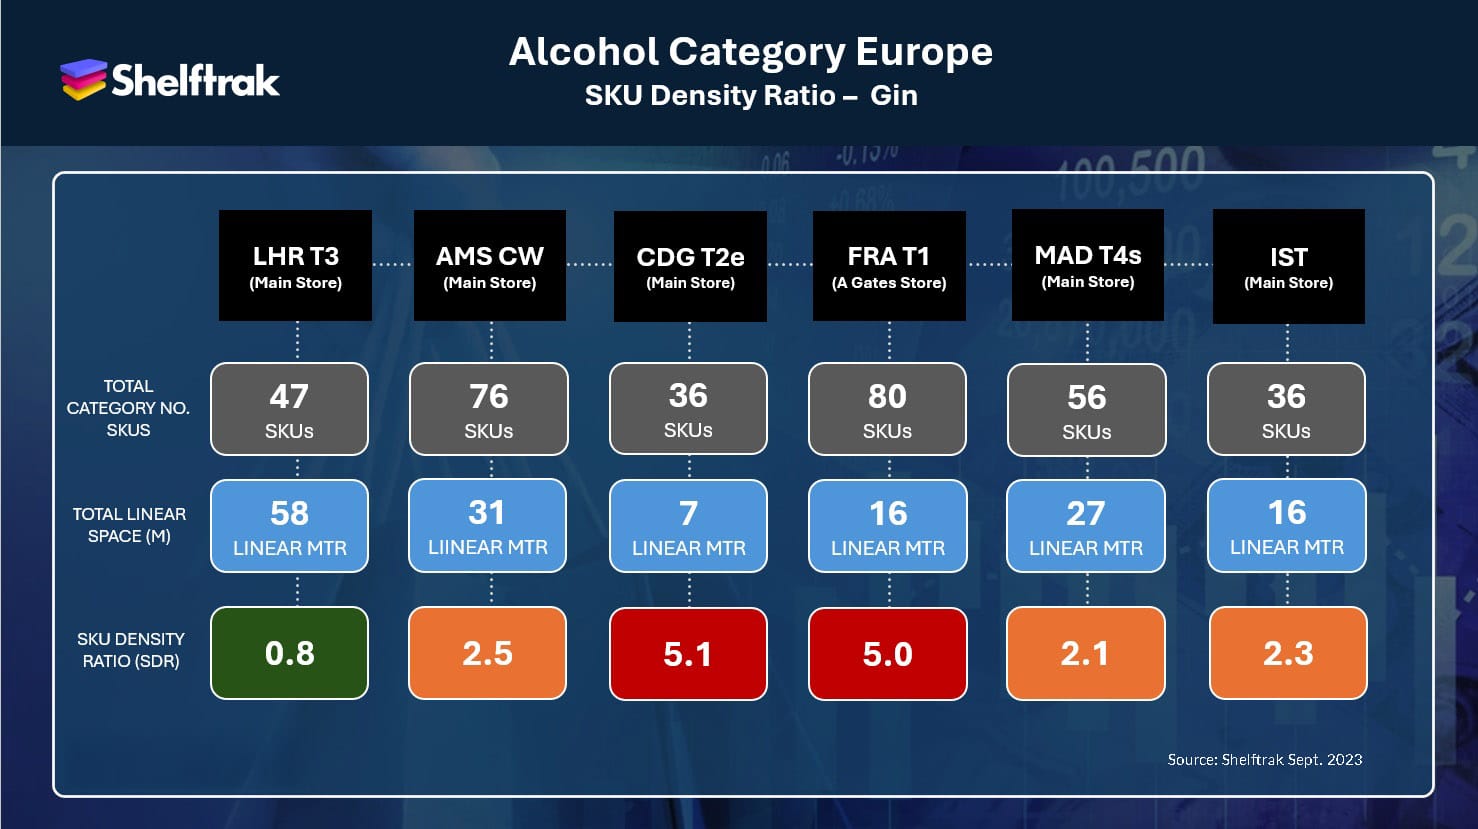
If we delve a little deeper, we can see at a sub-category level things are potentially even worse. Take Gin as an example. The explosion of the Gin market over the last few years has meant there’s a proliferation of SKU’s now available in the category. Retailers and brands have to work hard to curate a range that balances choice, exploration and shop-ability. We can see from the chart below that the size of the range differs across Europe and that the allocation of space given to the range also differs greatly (Driven by passenger profile).
However what is clear is that in many cases, the SKU Density measure suggests that the Gin category space in some locations has overcrowded shelves and very likely overwhelmed shoppers – something that is therefore hindering sales.
So, what can we conclude from these observations? In a nutshell, one size does not fit all when it comes to SKU density. While some sub-categories thrive on variety and choice, others demand a more curated approach. By striking the right balance between assortment breadth and shelf space, retailers can optimise the shopping experience and drive sales.
A well-considered range of products must be considered on a segment-by-segment basis where the role of that particular category (volume sales versus exploration as an example) has to be taken into account.
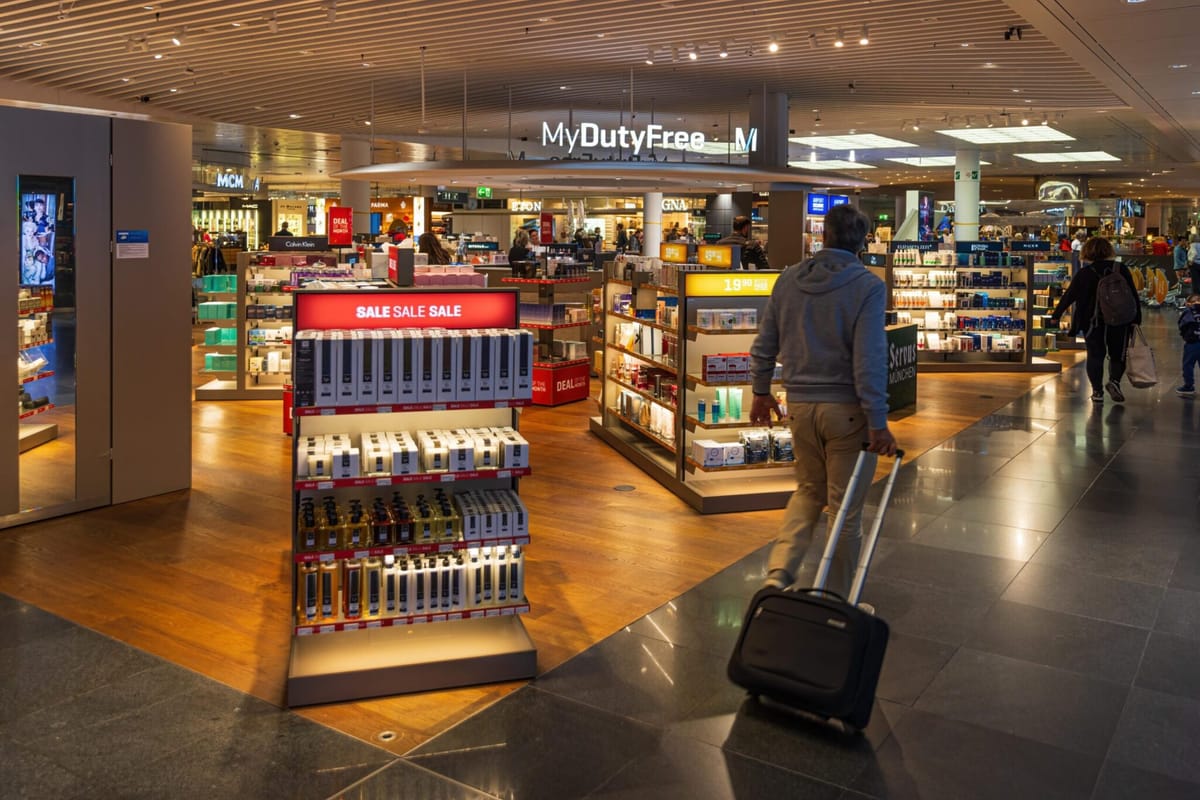
In the fast-paced world of travel retail, where every inch of shelf space has to be as efficient as possible, optimising SKU density is not just about making the most of limited real estate; it's about creating an environment where every product has the opportunity to shine, and every shopper feels inspired to explore.
With Shelftrak as a guide, we're not just navigating the retail landscape; we're shaping it to help retailers deliver a truly exceptional shopping experience for every traveller.

Don’t leave your travel retail success to chance
Shelftrak helps you monitor and optimise every display across your global duty-free footprint. Book a demo to see how our solution ensures you turn travelers’ heads – and capture their purchases – every time.