American Whiskey's Global Shelf Looks Stable. Shelftrak Data Reveals Otherwise.
American Whiskey looks stable on the global travel retail shelf. But store-level data reveals a very different picture of where growth is really being won and lost.

The illusion of category stability
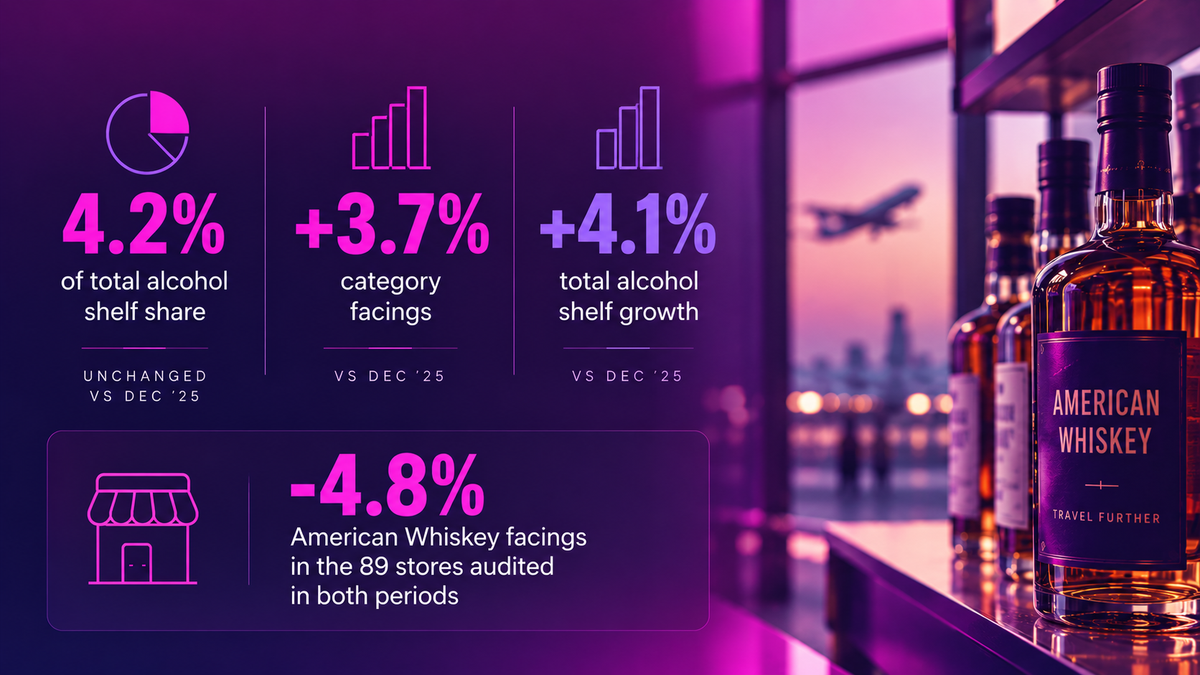
At first glance, American Whiskey looks like a predictable category on the global travel retail shelf. Shelftrak's April 2026 Wave 9 audit found the category holding 4.2% of total alcohol shelf share, unchanged since December 2025. Category facings grew 3.7%, broadly in line with the 4.1% growth of the total alcohol shelf. On paper, American Whiskey is simply keeping pace.
But a single category-level number can only tell part of the story.
Shelftrak's shelf intelligence goes further than aggregate market totals, tracking performance store by store. At that resolution, a very different picture emerges. Across the 89 stores audited in both periods, American Whiskey facings actually fell 4.8%.
That distinction matters. The category grew 3.7% across the wider audit panel, yet contracted in the stores measured consistently across both waves. Apparent category growth can therefore reflect changes in the store universe as well as genuine gains within existing locations.
This is the limitation of relying on category-level reporting alone. Where growth is actually being won — and where risk is building — becomes far more visible when performance is measured store by store.
Asia: the growth engine the averages miss
Nowhere is this more apparent than at regional level. Asia accounts for 5,491 facings across 35 stores — 40.8% of all American Whiskey facings in Shelftrak's global sample — and grew 10.6% since December 2025. It is the category’s largest region by shelf presence, while also recording the strongest growth.
Set against this, Europe was flat, IMEA grew 7.9%, and the Americas declined 7.5%. Four regions, four very different trajectories.
There is no single global American Whiskey trajectory. Instead, regional markets are moving independently and, in some cases, against each other.
For brands and retailers planning distribution and investment, that divergence matters. A strategy built around global averages risks overlooking Asia's momentum or assuming that performance in one region reflects conditions elsewhere. Understanding where to compete requires a level of regional granularity that the global headline cannot provide.

Where the real battle is fought: airports, retailers and SKUs
Even regional figures conceal considerable variation. Individual airports within the same broader markets are moving in opposite directions.
The top five airports account for 35% of category facings, in Shelftrak’s global audit. Yet performance within that group varies sharply: Melbourne grew 160%, while Auckland declined 17%. Changi, the largest airport in the audit by American Whiskey facings, declined 11%.
The same divergence is visible at retailer level. ARI grew 85%, Lotte DF 24% and Avolta 4%, while Heinemann declined 15% and Lagardère 12%. Avolta accounts for 19.9% of American Whiskey facings in the audit.
For suppliers, this means exposure to category growth depends partly on where they are distributed. A brand heavily weighted towards retailers or airports contracting their American Whiskey space faces a very different commercial environment from one exposed to expanding accounts, even if both sit within the same global category.
SKU-level concentration compounds this further. Shelftrak identified 314 American Whiskey SKUs across the audited shelf, yet the top 15 account for 54.5% of all category facings. Jack Daniel's No.7 alone represents 12.0% of the entire category.
So while American Whiskey looks broad in assortment terms, it behaves as a highly concentrated category in shelf-space terms.
For brand owners, this changes the strategic question. Success may depend less on continually adding incremental variants and more on ensuring that a smaller number of priority SKUs secure the right distribution, placement and share of facings — airport by airport and retailer by retailer.
This is precisely the kind of question Shelftrak is built to answer.
Which retailers are expanding American Whiskey space, and which competitors are capturing that growth? Where is a hero SKU gaining or losing facings? And which accounts should be prioritised in the next range review?
These are commercial questions, not simply descriptive ones — and they require store-level measurement.

Momentum beneath the dominant brands
Brand-level data tells a similarly nuanced story when looking beneath the headline rankings.
Jack Daniel's leads all four regions and accounts for 44.0% of category facings, while parent company Brown-Forman controls 51.9%. On the surface, the category remains exceptionally concentrated around its market leader.
Yet Shelftrak's tracking shows that Jack Daniel's facings declined 1.5% overall between December and April. Scale did not translate into growth.
Further down the rankings, momentum is building quickly. Skrewball grew 312.1%, while Great Jones increased 141.7%, Eagle Rare 68.9% and Four Roses Whiskey 56.2% in facings.
The regional picture makes this even more interesting. In the Americas, Great Jones grew 142% to become the region's fifth-largest brand by facings, even as the wider American Whiskey category there declined 7.5%. A challenger can therefore gain substantial shelf presence even while the regional category contracts around it.
None of these challengers are close to overturning the brands that dominate on scale. But shelf momentum is emerging well below the top of the rankings.
Brands and retailers looking only at current brand share risk missing that movement — and by the time sustained gains become obvious in the headline rankings, competitors may already have established valuable distribution and shelf presence.

The shelf's centre of gravity
Portfolio architecture provides another clue to where the category's competitive weight sits.
1L accounts for 60.1% of American Whiskey listings and 64.2% of category facings, making it by far the dominant travel retail format. Its median shelf price is $40, compared with $75 for 70cl.
Price architecture is similarly concentrated. 25.1% of category facings sit between $30 and $40, while a further 40.9% sit between $40 and $75. Together, those two tiers account for around 66% of category facings, revealing where much of the category’s physical shelf presence is concentrated.
This creates a clear centre of gravity. For suppliers, it provides a benchmark against which to assess whether priority SKUs, formats and price points are competing in the areas carrying most of the category's shelf weight — or occupying smaller, more specialised parts of the assortment.
Why store-by-store measurement is no longer optional
Taken together, these findings point to one conclusion: there is no single "global American Whiskey market" from an execution perspective.
Growth is uneven by region, airport, retailer, brand and SKU — and each layer of variation can disappear inside the one above it. A category can appear to grow across an expanded store universe while declining in like-for-like locations. A dominant brand can lose facings while challengers accelerate. A growing region can contain individual airports moving sharply in the opposite direction.
Brands therefore need to understand where to win as well as what to sell.
Shelftrak's store-level shelf audits allow brands and retailers to see where facings are being won or lost, which accounts are driving change, and where competitive momentum is developing before it becomes obvious in headline rankings.
For an industry accustomed to reading performance primarily at category or regional level, that additional resolution can turn shelf data from a description of what has already happened into a tool for deciding where to act next.
About the report
Shelftrak’s American Whiskey Category Landscape is based on physical shelf audits covering distribution, pricing, placement, promotions and execution across 13,462 SKU facings, 98 stores, 62 airports, 23 retailers and 71 brands, spanning 37 countries and four regions.
Shelftrak captures 29 data fields per SKU, including facings, price, linear space, promotions, shelf level, fixture type, TREX, NPD and pack size. Every figure in the report comes from physical shelf audits; no sales data is used. Wave 9 was audited in April 2026 and released on 30 June 2026, with December 2025 Wave 8 used as the comparison base.