Tequila's Global Shelf Looks Stable. What’s Really Happening?
Tequila’s global shelf share may look stable, but beneath the headline figure the category is shifting significantly. Shelftrak data reveals diverging growth across regions, airports and brands — showing where tequila’s shelf battle is really being fought.

The illusion of category stability
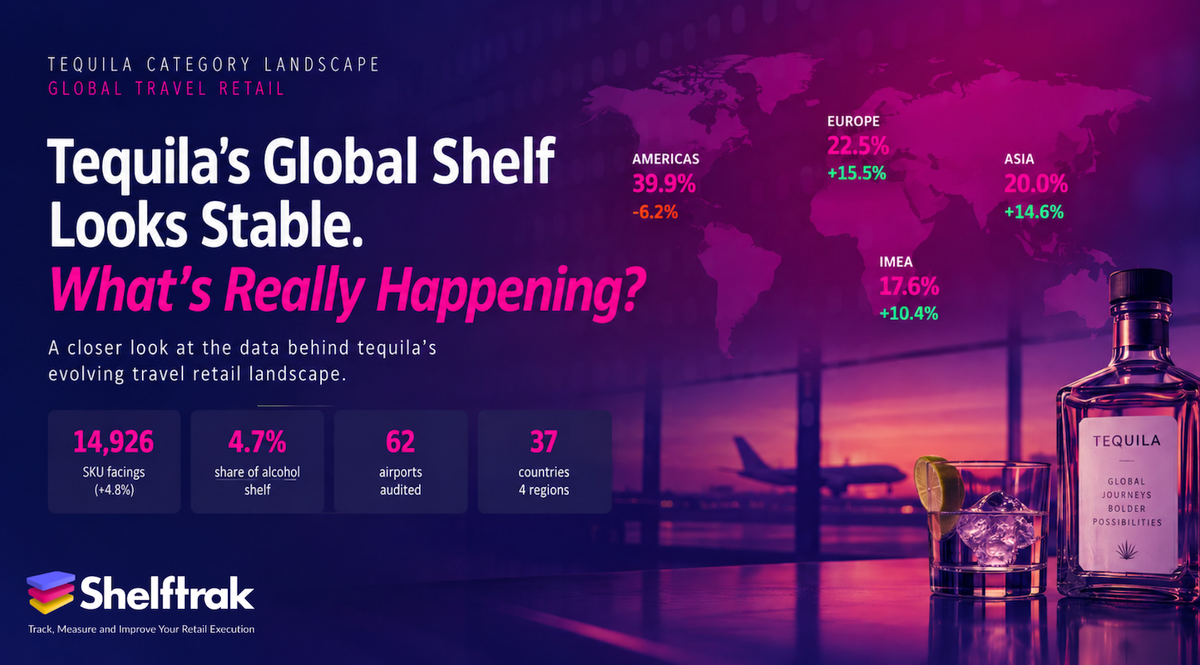
Tequila is holding its position in global travel retail. Shelftrak’s analysis across 62 airports found the category retaining the same proportion of the total alcohol shelf since December 2025 — 4.7%.
On paper, tequila looks like a settled category. However, a singular number fails to tell the full story. Shelftrak's latest audit reveals significant movement underneath that headline figure. Since December 2025, tequila’s facings rose 4.8% and outpaced the 4.1% growth of the total alcohol shelf itself.
Across the full audited panel, the category’s shelf presence expanded.
The Americas retreat while everyone else accelerates
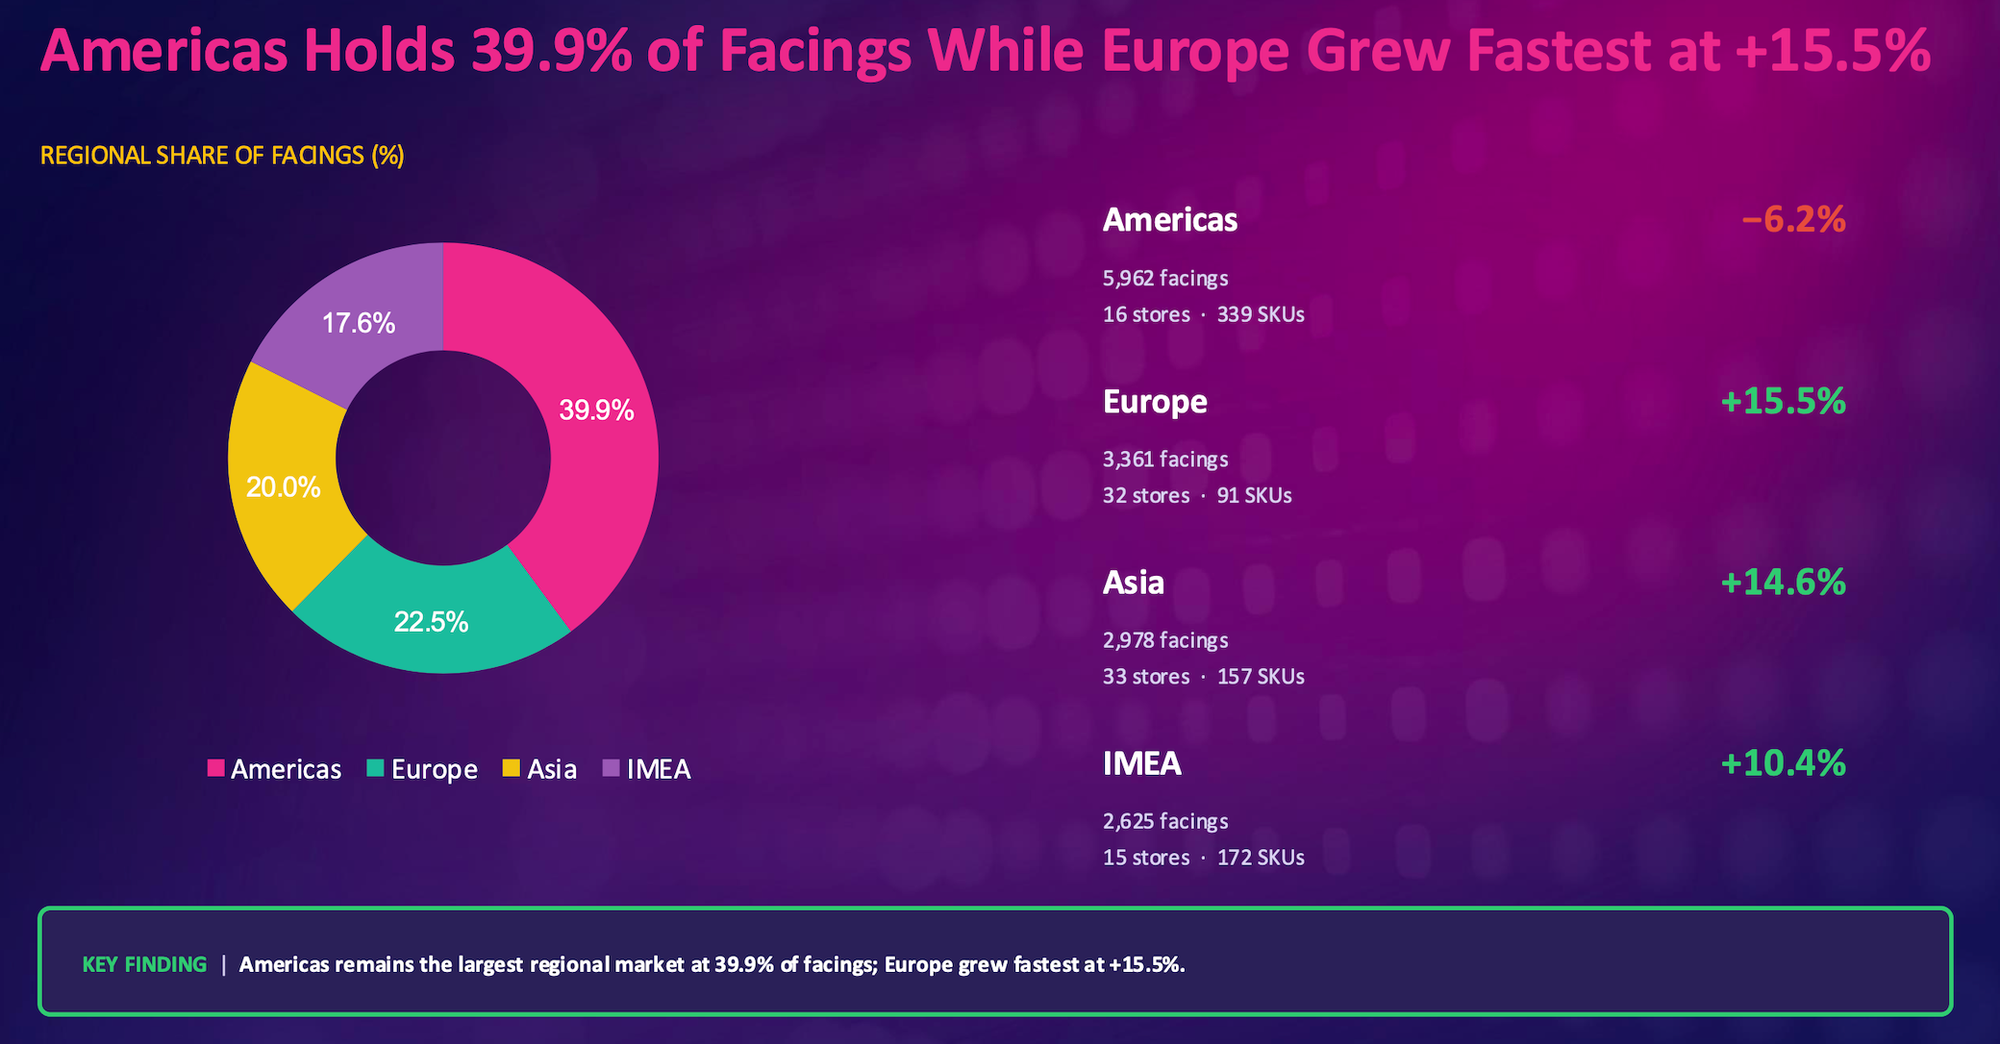
The geography behind tequila’s growth is changing significantly. The Americas remain tequila’s largest travel retail market by a considerable margin, encompassing 39.9% of global facings. However, this is also the only region in decline, losing 6.2% since December 2025. By contrast, Europe, Asia and IMEA grew 15.5%, 14.6% and 10.4% respectively.
Significantly, tequila’s largest regional shelf is moving in the opposite direction to every other region tracked. While the Americas still account for almost two in every five tequila facings globally, its shelf presence contracted as Europe, Asia and IMEA all recorded double-digit growth.
Category-level stability is therefore masking a significant geographic redistribution — one that global averages, on their own, cannot show.
Airports: the real battleground
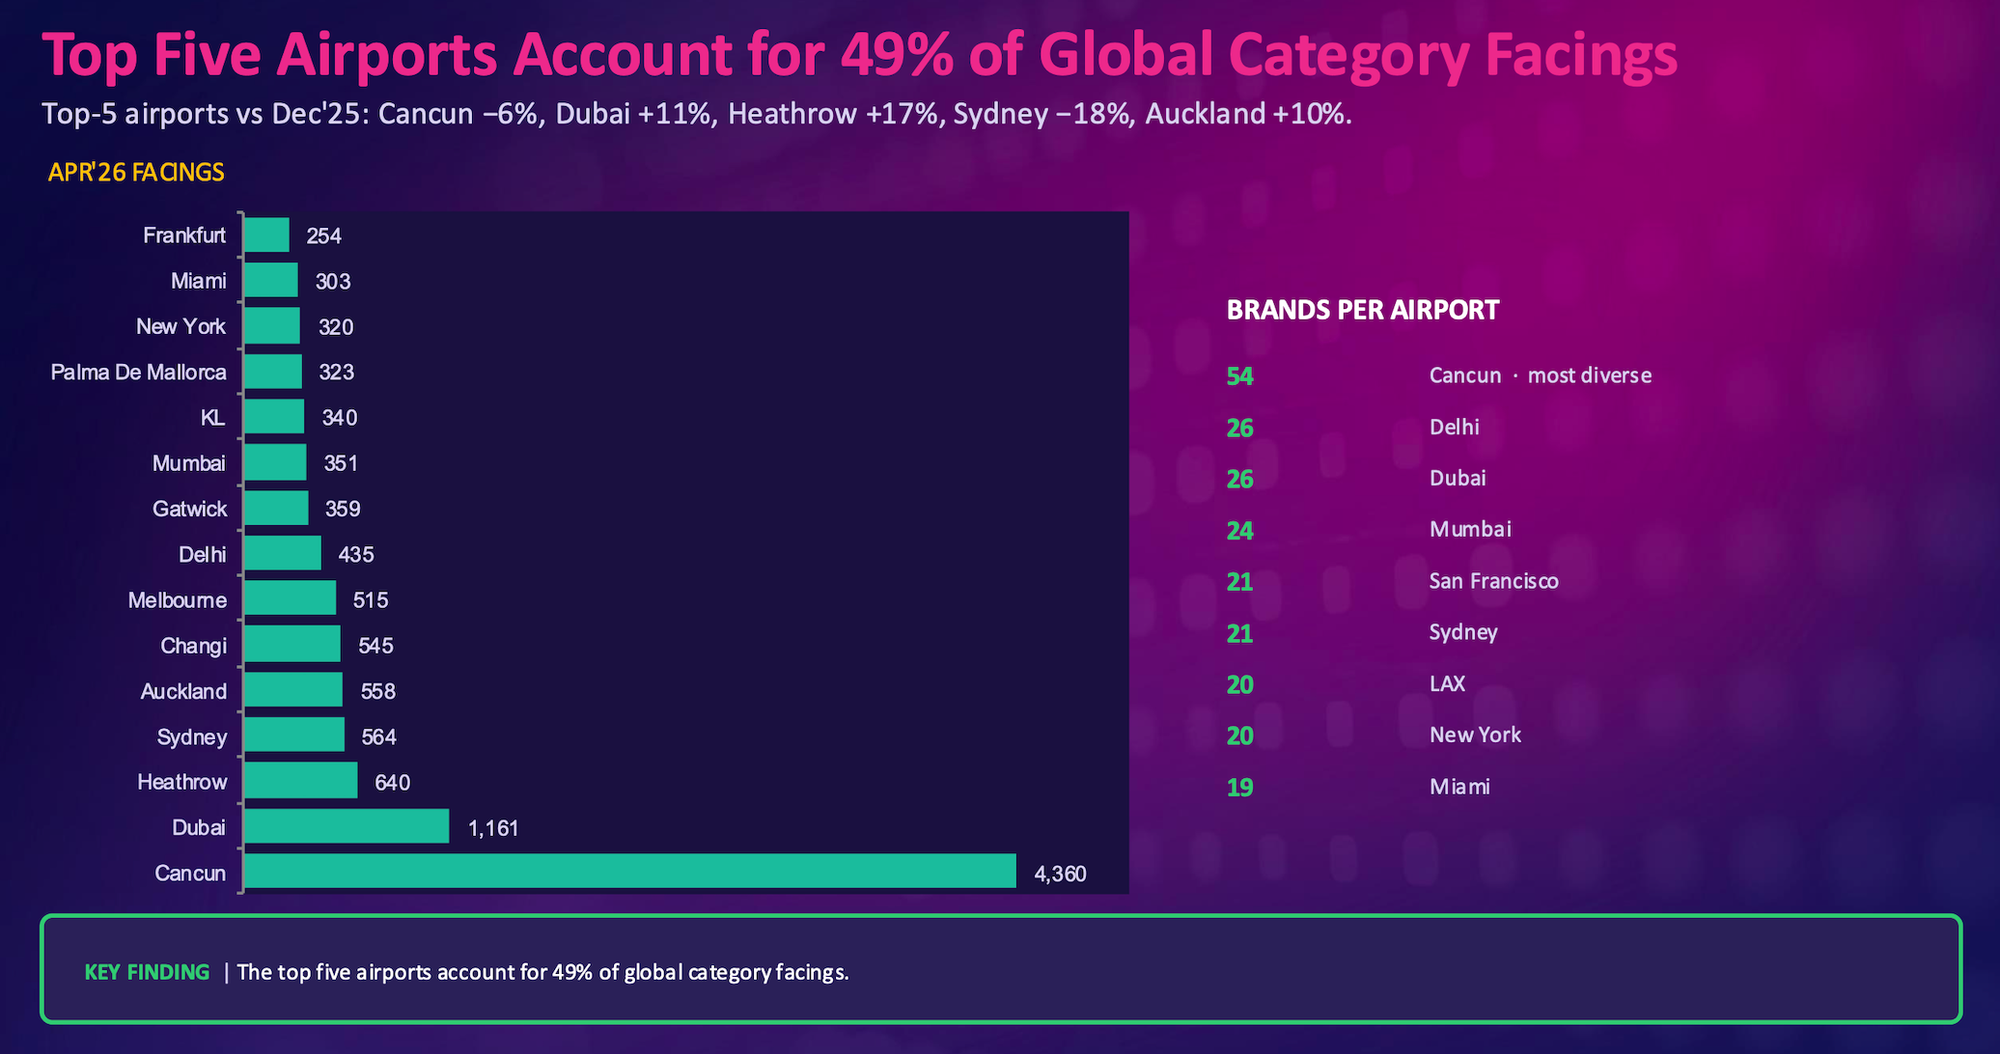
Drop below regional level, and the divergence gets sharper, not softer. The top five airports alone account for 49% of global category facings — a striking concentration that makes airport-level performance critical to understanding where tequila brands are actually winning or losing shelf presence.
Within this top tier, the disparities are significant. Auckland grew 10%, Dubai grew 11% and Heathrow grew 17%, while Sydney declined 18%. Cancun continues to dominate outright, with 4,360 facings and 54 brands competing for space — more than triple the facings of Dubai, the second-largest airport at 1,161. Yet even Cancun's scale did not protect it from decline: facings there fell 6%.
Scale and growth are clearly not the same thing, and an airport's size on the shelf says nothing about its direction of travel.
Unequal sharing of growth
Growth in a category does not guarantee growth for its incumbents. In fact, just four of tequila’s 12 largest brand owners increased their audited shelf presence between December and April.
At brand-owner level, Diageo (23.6% of category facings), Proximo (19.9%) and Bacardi (17%) together represent 60.5% of the category — but their fortunes are diverging sharply. Campari posted the strongest growth of any owner at 37.9%, followed by Diageo at 21.5% and Bacardi at 10.1%. Proximo, the category's second-largest owner by facings, declined 2.4%.
Category-level stability, in other words, is masking sharply diverging fortunes among the owners that control the majority of tequila’s shelf presence. Being large is no guarantee of growing.
Intensifying competition beneath the leaders
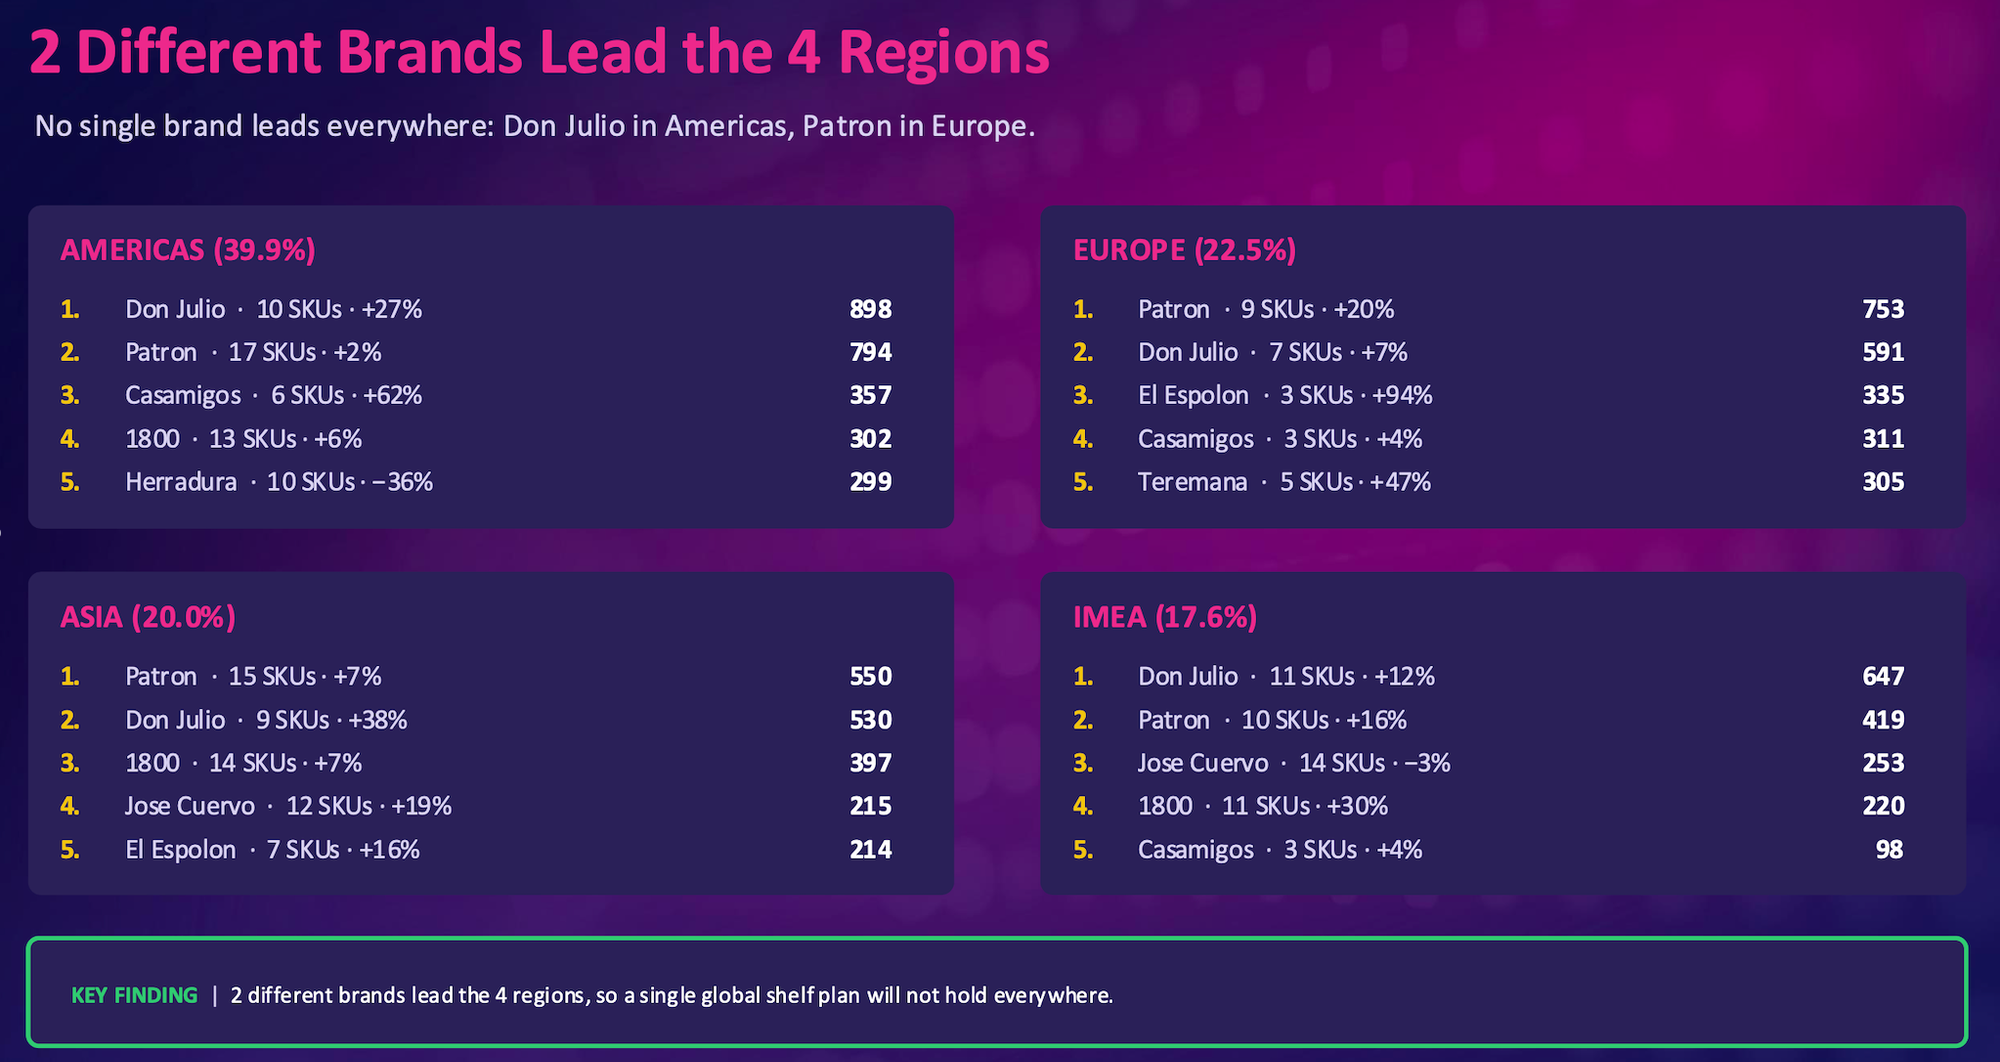
Leadership within tequila is well established: just 15 of 477 SKUs account for 37.4% of facings, with Don Julio and Patrón heavily represented among those leading SKUs. But leadership and momentum are diverging here too. Don Julio grew 20.0% and Patrón 10.2% — significant increases, but below the percentage growth recorded by several brands further down the ranking.
El Espolón's 668 facings grew 41.8%. Casamigos, with 861 facings, grew 26.2%. Gran Centenario, a smaller brand still, grew 91.4%. Each grew faster than the two market leaders, in percentage terms. The fastest percentage growth among the leading brands is therefore occurring below the two brands that dominate the shelf.
While these challengers are expanding from these considerably smaller bases, their growth rates point to intensifying competition beneath tequila’s established leaders.
Tequila’s competitive picture is increasingly local
This growth is not uniform, and that is the point. Different brands are breaking through in different regions, which means the competitive battle for tequila shelf space is becoming market-specific rather than global. Casamigos grew 62% in the Americas. El Espolón grew 94% in Europe. Don Julio: 38% in Asia. Three brands, three entirely different growth stories, each tied to a different part of the world.
A global view alone cannot capture this level of variation. A brand tracking only its worldwide growth number could see a healthy overall trend while missing that its momentum is concentrated in one region and stalling or retreating in another. Winning tequila's next phase of growth depends on knowing exactly where — airport by airport, region by region — that growth is actually happening.
The case for store-by-store measurement
Taken together, the findings show why category-level figures alone cannot describe what is happening on tequila’s travel retail shelf. A stable 4.7% category share sits above sharply different regional trajectories, airport-level gains and losses, diverging brand-owner performance and very different sources of brand growth.
Store-level measurement exposes those differences. It allows brands and retailers to identify where facings are being gained or lost, which locations are driving regional movement and where competitive positions are changing.
For a category in which the largest region is contracting while every other region is expanding at double-digit rates, that level of detail matters. The global number shows the category-level shelf pictures; store- and airport- level data shows where the underlying movement is actually happening.
About the report
ShelfTrak’s Tequila Category Landscape is based entirely on physical shelf audits across global travel retail. The April 2026 audit covered 14,926 SKU facings across 96 stores, 62 airports, 22 retailers and 104 tequila brands in 37 countries across four regions. ShelfTrak captured 29 data fields per SKU, including facings, price, linear space, promotions, shelf level, fixture type, TREX, NPD and pack size. No sales data is used anywhere in the report; every figure reflects observed shelf presence and execution at the time of audit.
Wave 9, covering April 2026, was released on 30 June 2026 and is compared with Wave 8 from December 2025. The reported 4.8% increase in tequila facings is based on the wider audited panel. On a like-for-like basis, across the 89 of 96 stores audited in both periods, tequila facings declined by 0.5%.